plot_on_average
- plot_on_average(sigs: ~mne.io.base.BaseRaw | ~mne.epochs.BaseEpochs | ~mne.evoked.Evoked | str | ~mne._fiff.meas_info.Info | list[~mne.io.base.BaseRaw | ~mne.epochs.BaseEpochs | ~mne.evoked.Evoked | str, ...], subj_dir: str | ~os.PathLike = None, rm_wm: bool = False, picks: list[int | str, ...] = None, surface: str = 'pial', hemi: str = 'split', color: <module 'matplotlib.colors' from '/home/docs/checkouts/readthedocs.org/user_builds/ieeg-pipelines/conda/latest/lib/python3.12/site-packages/matplotlib/colors.py'> = (1, 1, 1), size: float = 0.35, fig: ~mne.viz._brain._brain.Brain = None, label_every: int = None, background: str = 'white', units: str = 'm', transparency: float = 0.6, average: str = 'fsaverage', show: bool = True) Brain[source][source]
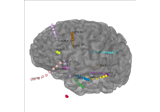
Plots the signal on the average brain
Takes a signal instance or list of signal instances and plots them on the fsaverage brain.
- Parameters:
sigs (
Union[Signal,list[Signal]]) – The signal(s) to plot. If a list, all electrodes will be the same color. If a single signal, each electrode will be a different color.subj_dir (
PathLike, optional) – The subjects directory, by default LAB_root / ‘ECoG_Recon’rm_wm (
bool, optional) – Whether to remove white matter electrodes, by default Truepicks (
list[int | str], optional) – The channels to plot, by default Nonesurface (
str, optional) – The surface to plot on, by default ‘pial’hemi (
str, optional) – The hemisphere to plot, by default ‘split’color (
matplotlib.colors, optional) – The color to plot, by default (1, 1, 1). If None, each electrode group will be a different color.size (
float, optional) – The size of the markers, by default 0.35fig (
Brain, optional) – The figure to plot on, by default Nonelabel_every (
int, optional) – How often to label the channels, by default Nonebackground (
str, optional) – Background colorunits (
str, optional) – Units of the electrodestransparency (
float, optional) – Transparency of the brainaverage (
str, optional) – The average brain to plot on, by default ‘fsaverage’show (
bool, optional) – Whether to show the figure, by default True
- Returns:
The figure brain object
- Return type:
Brain