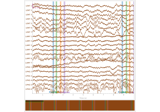
channel_outlier_marker
Identify bad channels by variance.
- Parameters:
input_raw (
Signal) – Raw data to be analyzed.outlier_sd (
int, optional) – Number of standard deviations above the mean to be considered an outlier, by default 3max_rounds (
int, optional) – Maximum number of variance estimations, by default runs until no more bad channels are found.axis (
int, optional) – Axis to calculate variance over, by default 0save (
bool, optional) – Whether to save bad channels to raw.info[‘bads’], by default Falseverbose (
bool | str | int | None) – Control verbosity of the logging output. IfNone, use the default verbosity level. See the logging documentation andmne.verbose()for details. Should only be passed as a keyword argument.
- Returns:
List of bad channel names.
- Return type:
list[str]
Examples
>>> import mne
>>> from ieeg.io import raw_from_layout
>>> bids_root = mne.datasets.epilepsy_ecog.data_path(verbose=False)
>>> layout = BIDSLayout(bids_root)
>>> raw = raw_from_layout(layout, subject="pt1", preload=True,
... extension=".vhdr", verbose=False)
Reading 0 ... 269079  =      0.000 ...   269.079 secs...
>>> bads = channel_outlier_marker(raw, 3, 2)
outlier round 1 channels: ['AST2']
outlier round 1 channels: ['AST2', 'RQ2']
outlier round 1 channels: ['AST2', 'RQ2', 'N/A']
outlier round 2 channels: ['AST2', 'RQ2', 'N/A', 'G32']
outlier round 2 channels: ['AST2', 'RQ2', 'N/A', 'G32', 'AD3']
outlier round 2 channels: ['AST2', 'RQ2', 'N/A', 'G32', 'AD3', 'PD4']