Note
Go to the end to download the full example code.
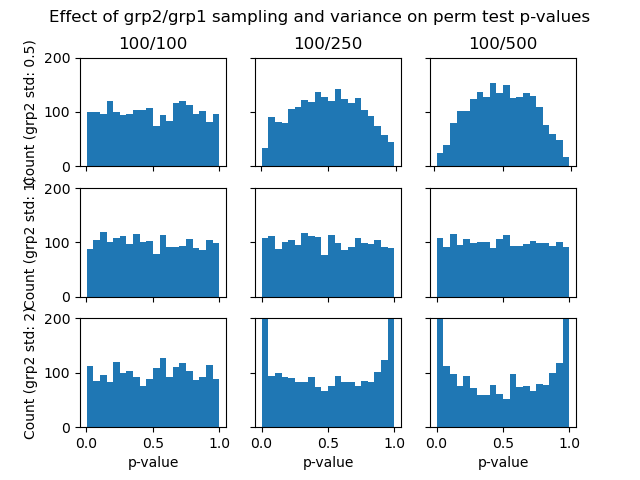
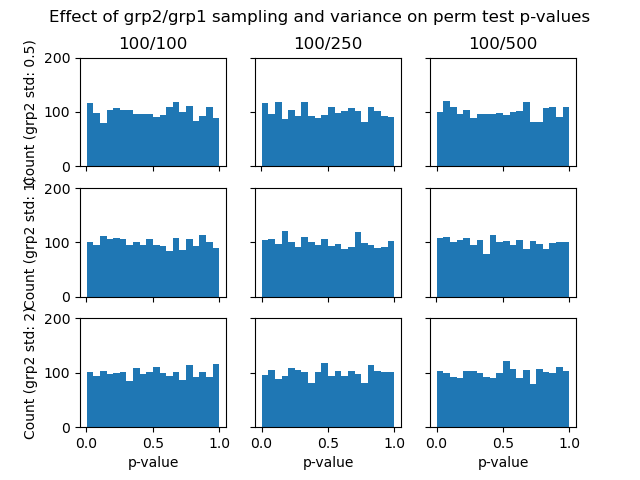
Bias simulation in permutation tests
- Shows how to simulate bias in permutation tests by varying the sampling
proportions and standard deviations of two groups.
import ieeg.viz
import matplotlib.pyplot as plt
from ieeg.calc.fast import ttest
from scipy.stats import ttest_ind, permutation_test
import numpy as np

# allocate memory for two normal distributions
n = 2000  # number of samples
m = 2000  # number of vectorized iterations
rng = np.random.default_rng()
arr1 = rng.normal(10, 1, (n, m))


def func(*data, axis=0):
    return ttest_ind(*data, axis=axis,
                     nan_policy='omit').statistic


# set up permutation test parameters
kwargs = {'n_resamples': 1000, 'batch': 100,
          'alternative': 'greater', 'vectorized': True, 'axis': 0,
          'rng': rng}
samplings = ((100, 100), (100, 250), (100, 500))

stds = (0.5, 1, 2)

funcs = [func, ttest]
for f in funcs:
    kwargs['statistic'] = f
    fig, axss = plt.subplots(3, 3)
    # iterate over the standard deviations
    for i, axs in zip(stds, axss):

        # group 2 has different std
        arr2 = rng.normal(10, i, (n, m))

        # iterate over the sampling proportions
        for (prop1, prop2), ax in zip(samplings, axs):

            # combine the distributions and boxcox transform

            data = np.concatenate([arr2[:prop1], arr1[:prop2]], axis=0)
            # inputs = boxcox_trans(arr2[:prop1], arr1[:prop2], axis=0)[0]
            # temp = (data - data.min() + 0.001).flat
            # lam = boxcox_normmax(temp, method='mle')
            # print(lam)
            # data.flat = _boxcox(temp, lam)
            # data_fixed = cox(data)
            inputs = [data[:prop1], data[prop1:]]

            # run the permutation test
            res = permutation_test(inputs, **kwargs).pvalue

            # plot the histogram of p-values
            ax.hist(res, bins=20)
            ax.set_ylim(0, 200)
            if prop2 == 100:
                ax.set_ylabel(f'Count (grp2 std: {i})')
            else:
                ax.set_yticklabels([])
            if i == 2:
                ax.set_xlabel('p-value')
            else:
                if i == 0.5:
                    ax.set_title(f'{prop1}/{prop2}')
                ax.set_xticklabels([])
    fig.suptitle("Effect of grp2/grp1 sampling and variance on perm test p-values")
Total running time of the script: (1 minutes 7.796 seconds)
Estimated memory usage: 3716 MB
Related examples